
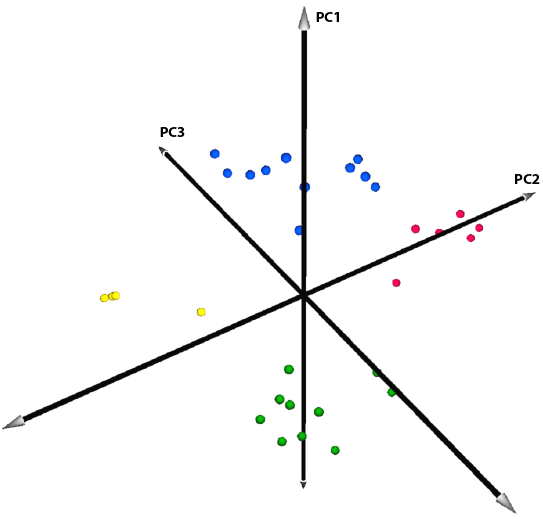
This was the first of the PCA plots that I created using MeV. The labels for the datapoints have been removed to avoid any “double-publishing” conflicts with the impending paper. This view was nice and clean, clearly illustrating the four distinct groups of points. The downside is that it really lacks depth and fails to communicate the distance between some of the datapoints. We didn’t want to be misleading with the perspective, and so we started searching for a more informative way to plot this data.