
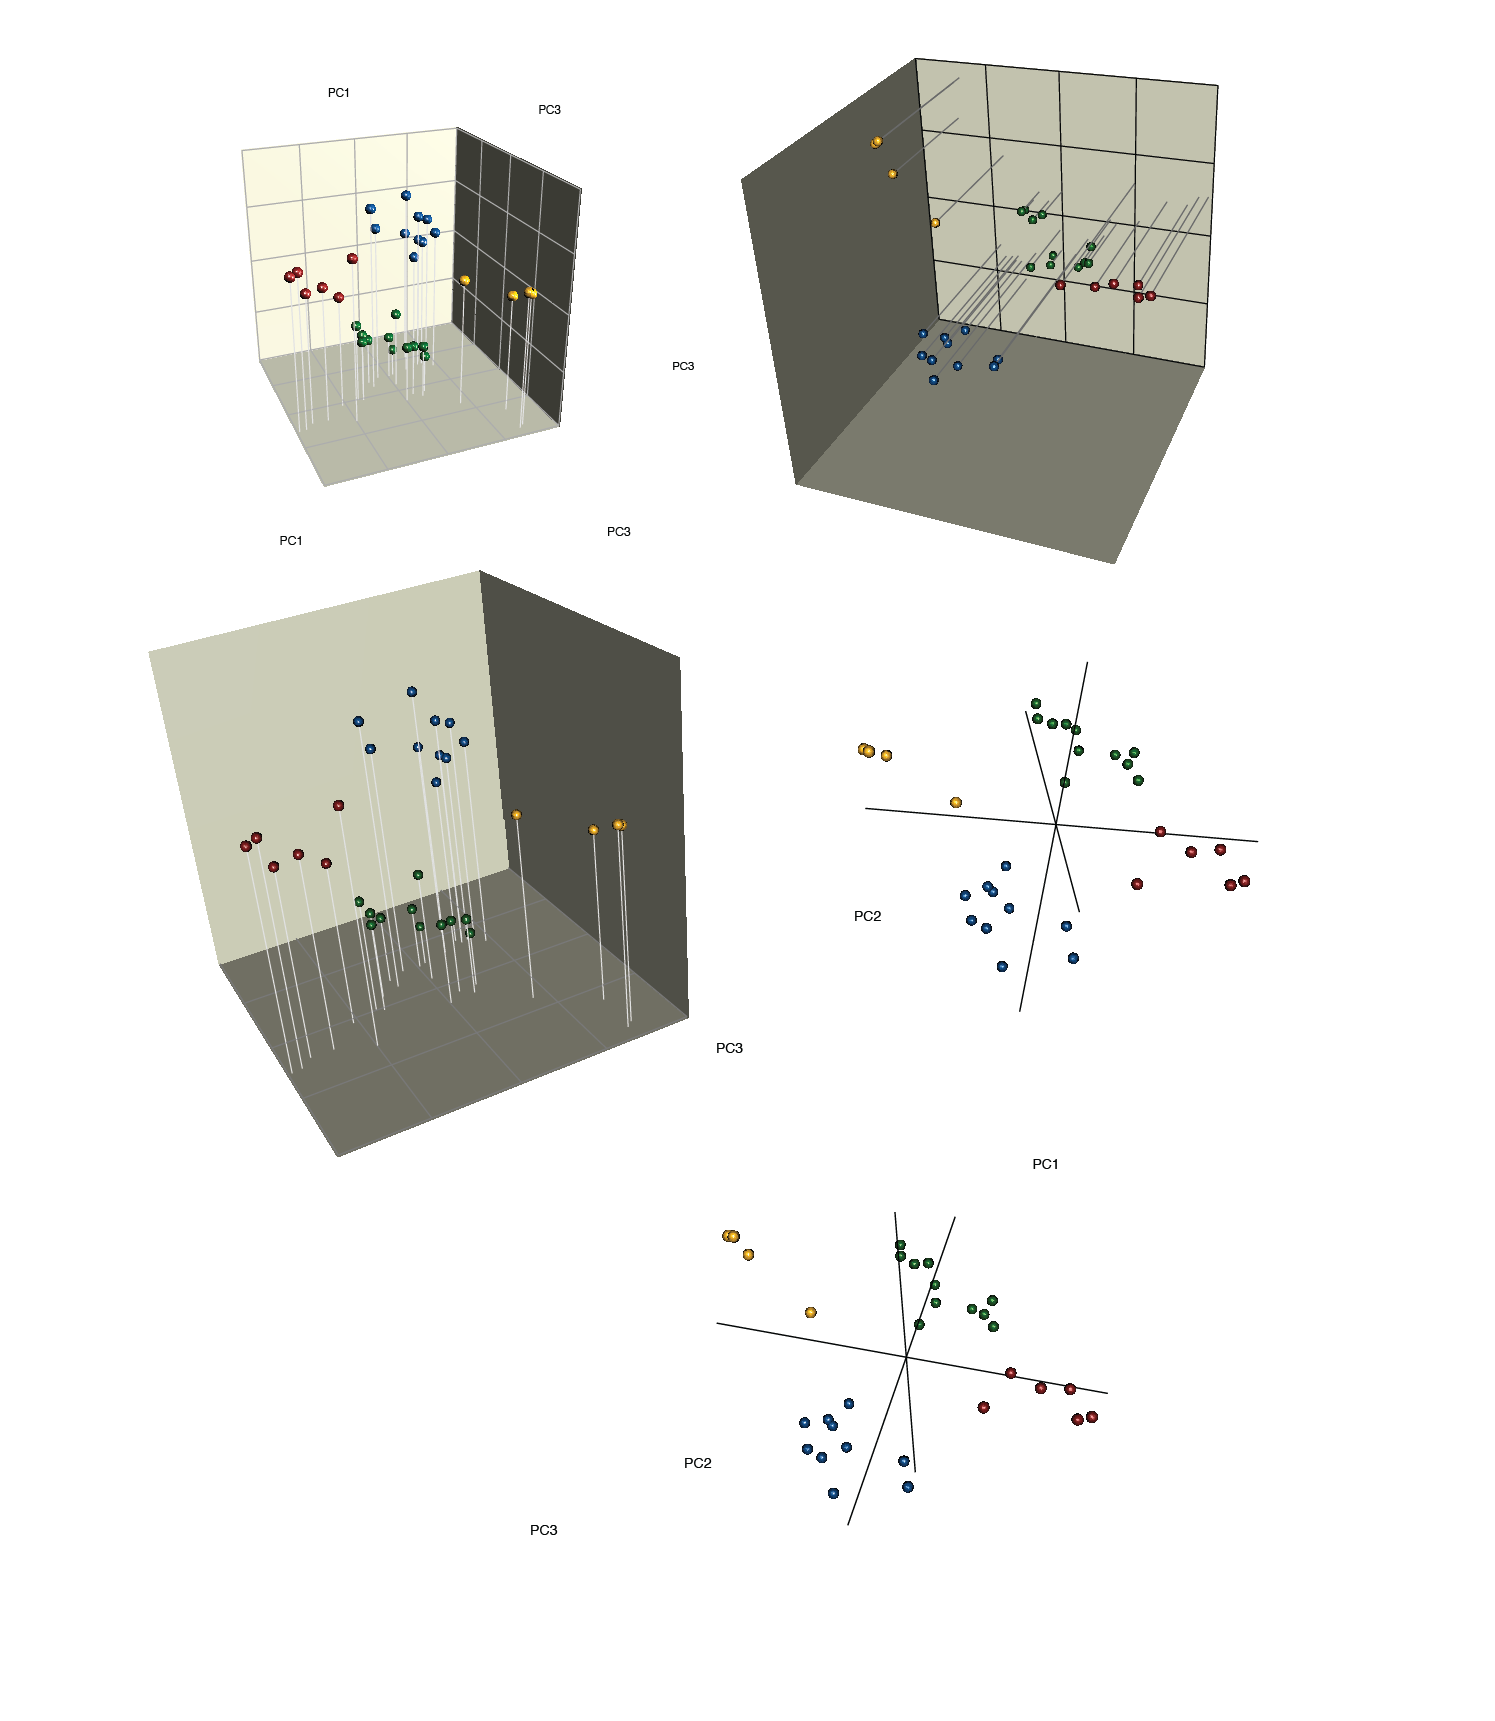
The solution to all my problems with the scatterplot3d package turned out to be a different R package: rgl.
I tried messing around with different 3d plotting software out there, and they were all either comercial solutions, or made importing a simple tab-delimited text file way more difficult than it had to be.
These images are just a glut of different things I was trying out using the new package It is quite powerful, letting you spin the viewing angle and control all plot elements. The default chart axes however, left something to be desired. In all the images I have removed the default plot elements and replaced them with panels and lines that I added in using various functions. Each line in that plot had to be specified with two sets of 3d coordinates (start of the line and and of the line) that I had to code in. It was a bit of a pain.
Note the reappearance of the three sided box. I tried various combinations of grids, “pegs”, sizes of balls etc. The top left image is very close to what I hope will be the final version of the figure, although it has introduced another complication: lighting.